.avif)
Percentage of quarter-hours in which market-oriented BESS operation exceeds grid extremes (%)
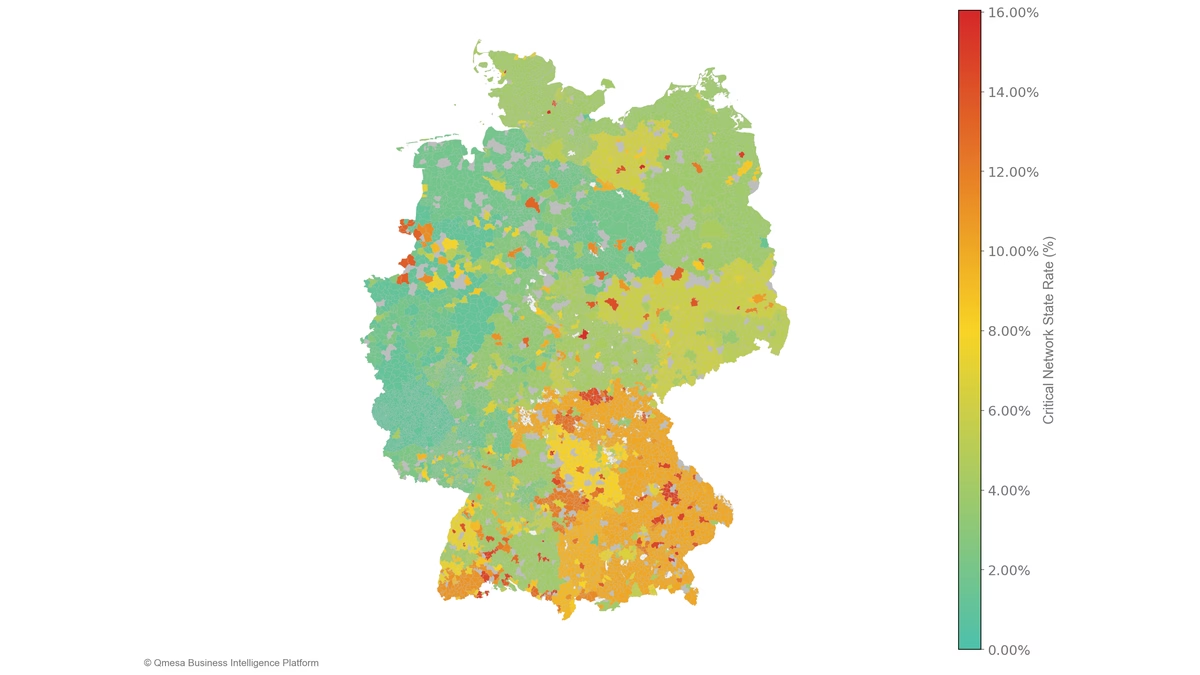
Note: Municipalities mapped to dominant DSO if at least one DSO has >1% of capacity. Multi-DSO areas (≥2 DSOs>35%) shown in grey. Analysis based on 2024 data. BESS capacity is calculated as a 30% * maximal difference between 'Hard Limits' and 'Safe-to-Operate' envelope.
Germany's grid operators face a historic bottleneck. Across TSOs and DSOs, total connection requests are projected to approach 700 GW by the first half of 2025. Based on estimations from Handelsblatt and Regelleistung-Online, DSOs alone face a queue exceeding 350 GW. The majority of this volume is concentrated among just three operators: E.DIS, Westnetz, and Mitnetz.
This creates a dual crisis:
As of late 2025, developers have two primary strategies to connect a BESS project:
Our analysis focuses on the standalone path, solving the primary bottleneck: getting projects connected faster.
To break the gridlock, regulators have introduced Flexible Connection Agreements (FCAs). Asset owners can bypass the queue by agreeing to usage constraints - limitations on charge/discharge/ramp rates - stated in §17 (2b) EnWG for standalone storage and §8a EEG for renewables/co-located storage.
While the regulator defined FCA types (static, dynamic, fully dynamic), a standardized, data-driven methodology is missing.
Research institutions like Forschungsstelle für Energiewirtschaft (Ffe) show how grid-supportive/grid-neutral operations can look like, but DSOs and developers lack a shared tool to calculate and value the financial impact of these constraints.
At Qmesa, we bridge this gap with Flexible QBoundaries, a methodology designed to implement §17(2b) EnWG agreements consistently.
Qmesa Business Intelligence Platform aligns project developers and DSOs, facilitating negotiations that guarantee win-win outcome: grid safety while securing a profitable IRR.
Our framework is a data-driven model for defining grid limits based on profitability and historical grid capacity extremes. The analysis uses 2024 TSO load and PV and wind generation data, allocated to the DSO level according to MaStR capacity data and Destatis population data.
Net Load = (Allocated Solar + Wind) - Allocated Load per DSO in given scenario (MW)
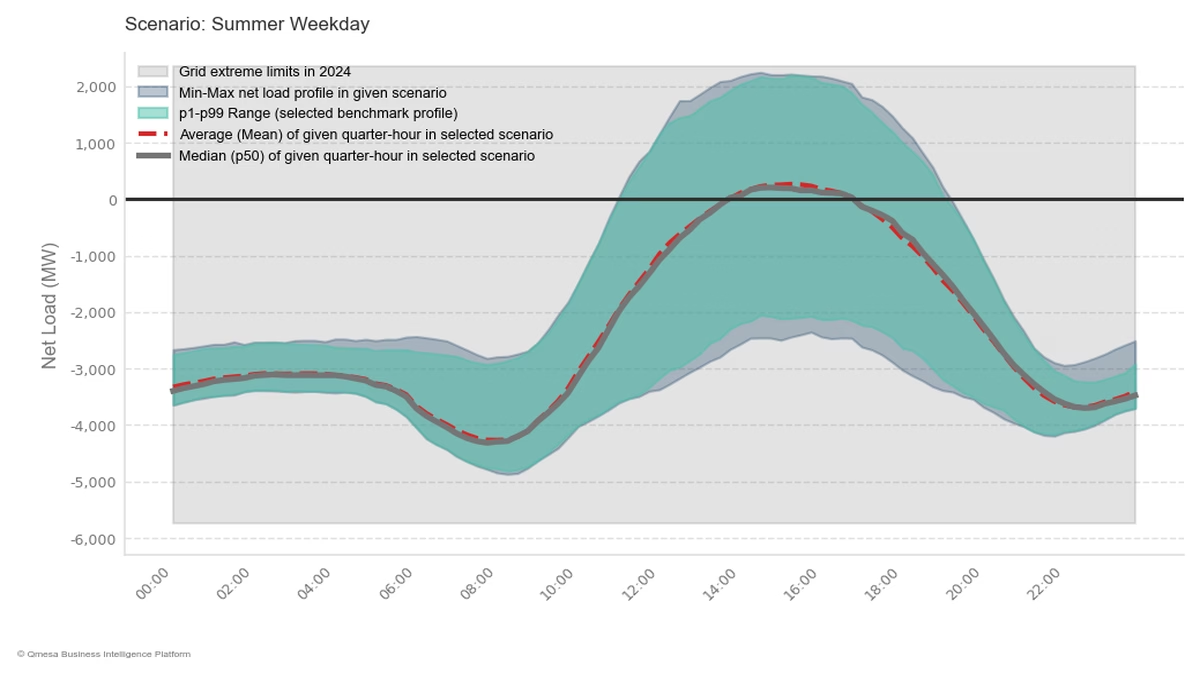
Note: data per DSO are allocated from TSO level (ENTSO-E) based on capacity installed (MaStR) and number of inhabitants (Destatis).
This two-level approach provides the foundation for BESS constraints. The available capacity for BESS operations is the space between the "Hard Limits" and the "selected benchmark profile".
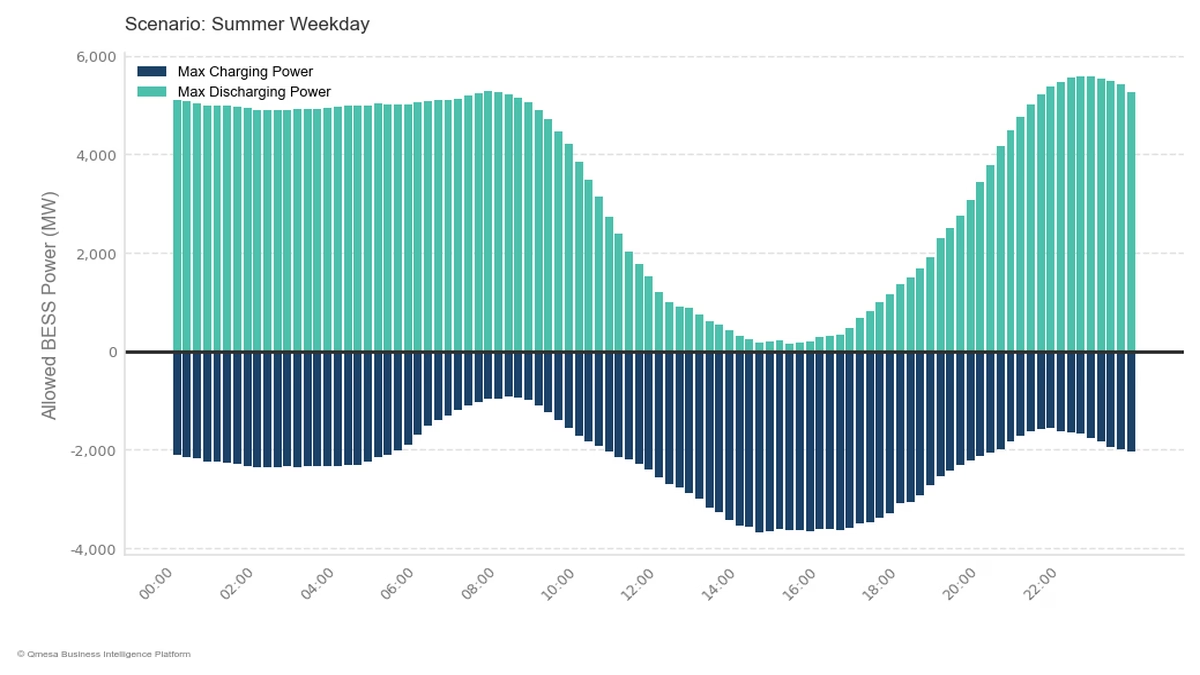
Qmesa Business Intelligence Platform delivers a tangible operational tool that visualizes the precise charging (dark blue) and discharging (green) capacity available to a BESS for every quarter-hour.
Quarter-hourly constraints that ensure BESS operation does not push grid beyond historical capacity limits with selected probability (MW)
Grid-neutral constraints inevitably impact "market-only" revenue streams, potentially reducing optimized revenues by 20–45%. However, this trade-off is the price of connection.
While a theoretical unconstrained project might model higher returns, it is currently unbuildable. With Flexible QBoundaries, we see achievable IRRs of 8–12% across the majority of German DSOs, rising to 14% primarily in West Germany.
Our framework unlocks the real, connectable business case. It identifies the most valuable DSOs with even 14% IRR projects that are connectable today. Qmesa Business Intelligence Platform's result is the new, realistic revenue baseline that developers can then use to model the impact of their project-specific costs.
Internal Rate of Return (IRR) per DSO based on grid-neutral flexible boundaries (%)
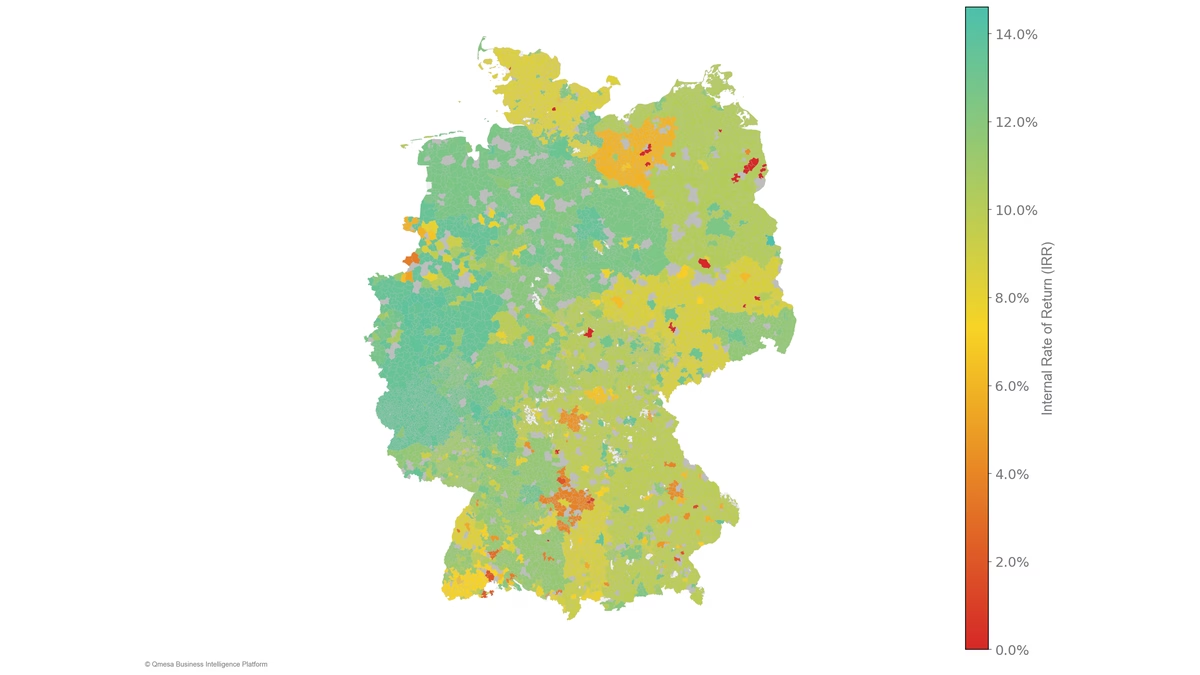
Note: Municipalities mapped to dominant DSO if at least one DSO has >1% of capacity. Multi-DSO areas (≥2 DSOs>35%) shown in grey. Analysis based on 2024 data. BESS capacity is calculated as a 30% * maximal difference between 'Hard Limits' and 'Safe-to-Operate' envelope.
We strongly advise calibrating our model in every grid connection negotiation based on more accurate data from the grid operator and the BESS owner.
Disclaimer: Analysis based on publicly available data; specific calibration to grid area required.
To book a call on designing flexible boundaries based on actual data, contact us at: markus@qmesa.eu