Virtual Battery Flex can play a big role to improve DBA Management
December 10, 2025
The analysis indicates that deploying 2,300 MW of virtual BESS flexibility products yields a net annual uplift of €33–49M. Qmesa enables DSOs to reduce DBA costs and mitigate risk by providing independent data modeling within the Qmesa Business Intelligence Platform, transforming volatile risks into managed portfolios.
Key Takeaways
The Reality: Despite the introduction of differentiated new Standard Load Profiles (SLP), i.e. temperature-driven and prosumer SLPs, spot price volatility and structural challenges have turned the Differenzbilanzkreis (DBA) from a passive accounting volume into a significant financial risk that needs to be managed – when the DSO uses synthetic SLPs.
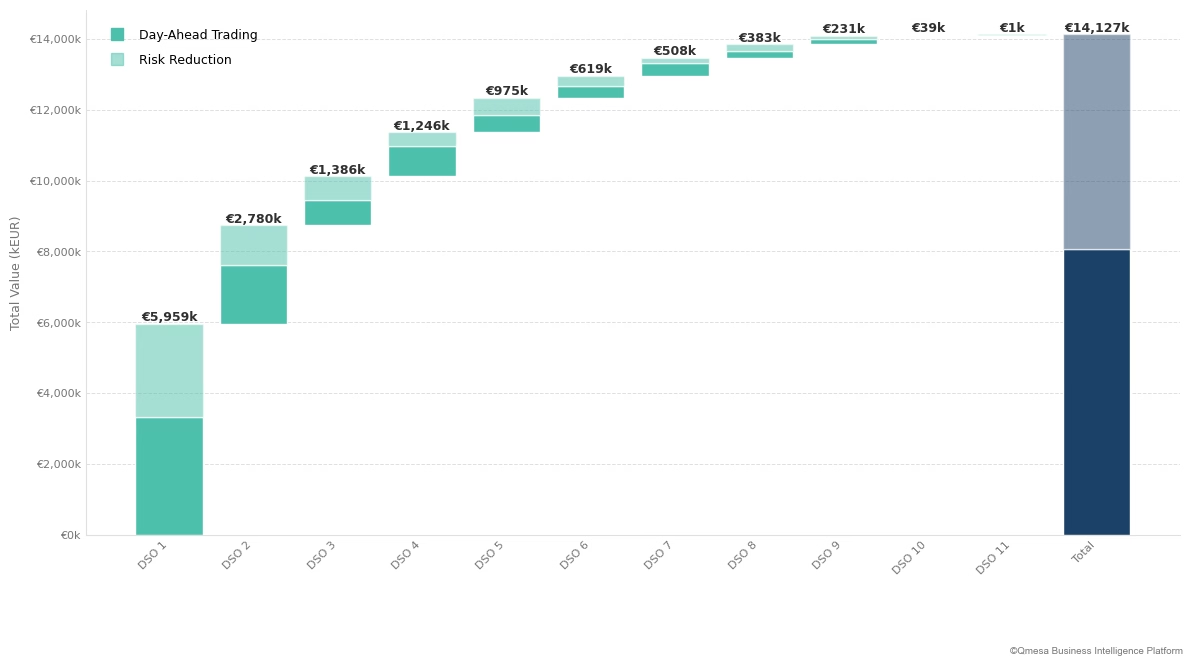
The Opportunity: Our analysis based on the Qmesa Business Intelligence Platform of 11 German DSOs (that publish a recent DBA time series) indicates that deploying total 981 MW of (virtual) battery flexibility yields a net annual uplift of €14.1M.
The Scale: Extrapolating this benchmark to all German DSO suggests a national cost & risk pool of €33-49M that can be mitigated with ~2,300 MW battery flex. The potential mitigation base is expected to vary significantly across DSOs.
The Execution: Qmesa enables DSOs to reduce these costs and manage the risks by providing the independent data modelling required to simulate, structure, and tender these virtual flexibility products, transforming volatile risks into managed portfolios.
Figure 1: The Value Waterfall. Total Uplift across the analysed cluster. The navy bar represents the total €14.1M annual value generated.
Total value ('000 €)
Note: The DSOs considered in the analysis represents different sizes and characteristics of DSOs representing together around 43% of total German grid length.
The Mechanism and Financial Exposure
In less volatile markets lacking the current prosumer density, the financial impact of Differenzbilanzkreis (DBA) was much lower. Defined by the BDEW and mandated by the MaBiS rules, the DBA captures the aggregate deviation between the Standard Load Profiles (SLP) allocated to suppliers and the actual physical consumption of those SLP customers. It is the structural imbalance of the distribution grid.
The core risk associated with the DBA - after correcting for over-/undertake quantities - stems from a structural "lose-lose" bias: the DBA position tends to be "long" when prices are low, and "short" when prices are high. The financial impact of this inverse correlation has intensified with the rise of renewable energy and increased spot price volatility.
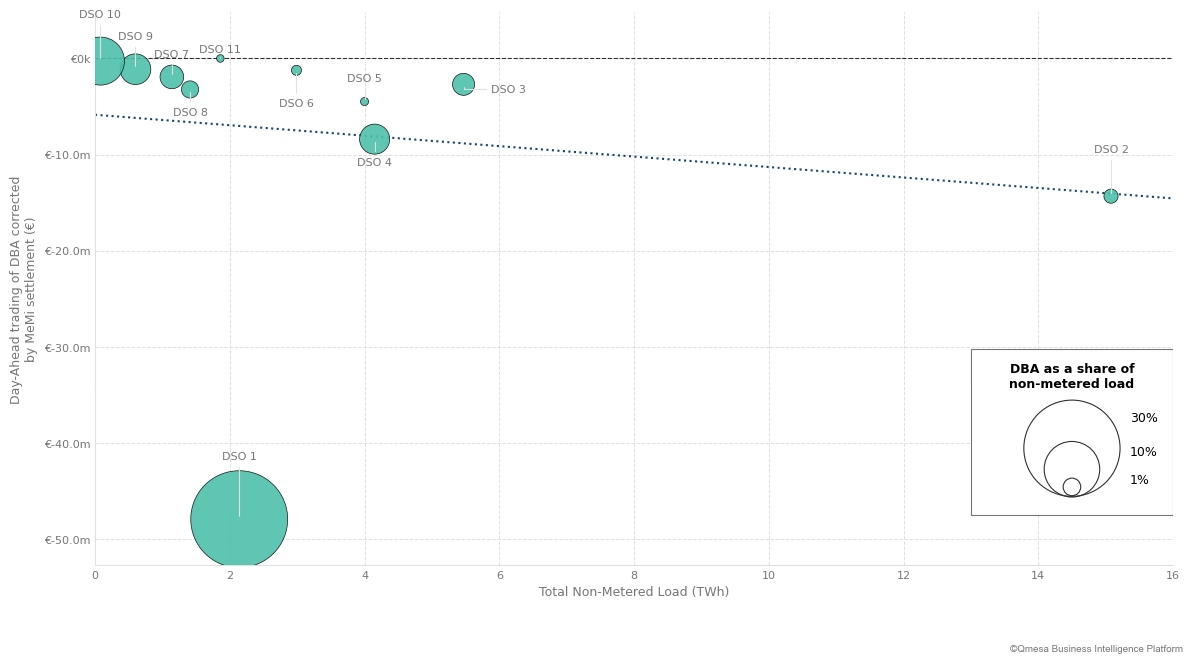
Insights from the Qmesa Business Intelligence Platform reveal that every analyzed DSO realized a net loss in 2024 (based on DBA volumes traded fully on the Day-Ahead market and corrected by MeMi settlement). However, the magnitude of this exposure varies significantly by DSO:
Strategic Mitigation: In 2024, DSOs 5, 6 and 11 outperformed the cluster average, suggesting that SLP granularity drives value. This performance could be attributed to lower prosumer penetration in the grid or superior prosumer forecasting.
The "Accuracy Gap": The 2024 DBA figures for DSO 1 may illustrate the compound risk of high renewable penetration and low metering. With a DBA-to-Non-Metered Load ratio of 30% (the largest "bubble" in Figure 2), it recorded the highest aggregate losses.
The Metering Hedge: DSO 10 exhibits a low DBA exposure in 2024. Despite lower SLP accuracy than other DSOs (indicated by a 3.8% DBA-to-Non-Metered load ratio), the absolute financial impact was minimal due to a very low rate of non-metered customers (~0.45%).
Figure 2: Efficiency Frontier. This bubble chart plots the MeMi-corrected trading result against total non-metered load. The bubble size represents the specific SLP error (DBA as a share of non-metered load).
Day-Ahead trading of DBA corrected by MeMi settlement (€) vs. total non-metered load (TWh)
The Constraint: DSOs operate under a strict regulatory "straitjacket" (e.g., § 13 StromNZV). Their mandate is cost minimization and non-discriminatory network operation. As the data demonstrates, management based solely on linear products (tenders for standard products, load profiles, and spot trading) seems no longer sufficient, leaving DSOs exposed to market volatility.
The Root Cause: Structural Deviation in the Prosumer Era
The industry is currently transitioning from generic profiles (H0) to differentiated logic. For example, a few DSOs have introduced specific profiles for prosumers with and without PV, and the BDEW is rolling out the P25 (PV) and S25 (Storage) profiles for the 2025/2026 period.
What this solves: These new profiles account for the average self-consumption effect, mathematically lowering the expected residual load during solar hours.
What remains unsolved: Crucially, these profiles remain static statistical averages. A P25 profile models the "expected" solar generation for a typical day, but it is not dynamic – it does not react to today’s actual weather.
The Implication: On a cloudy summer day, the profile assumes high generation (and thus low grid withdrawal), but the reality is low generation (high grid withdrawal). The DSO becomes unexpectedly "Short". Conversely, on an exceptionally sunny day, the DSO becomes "Long". As PV penetration grows, the amplitude of this "Profile vs. Reality" error increases, leaving the DSO exposed to volatility despite better baseline profiles.
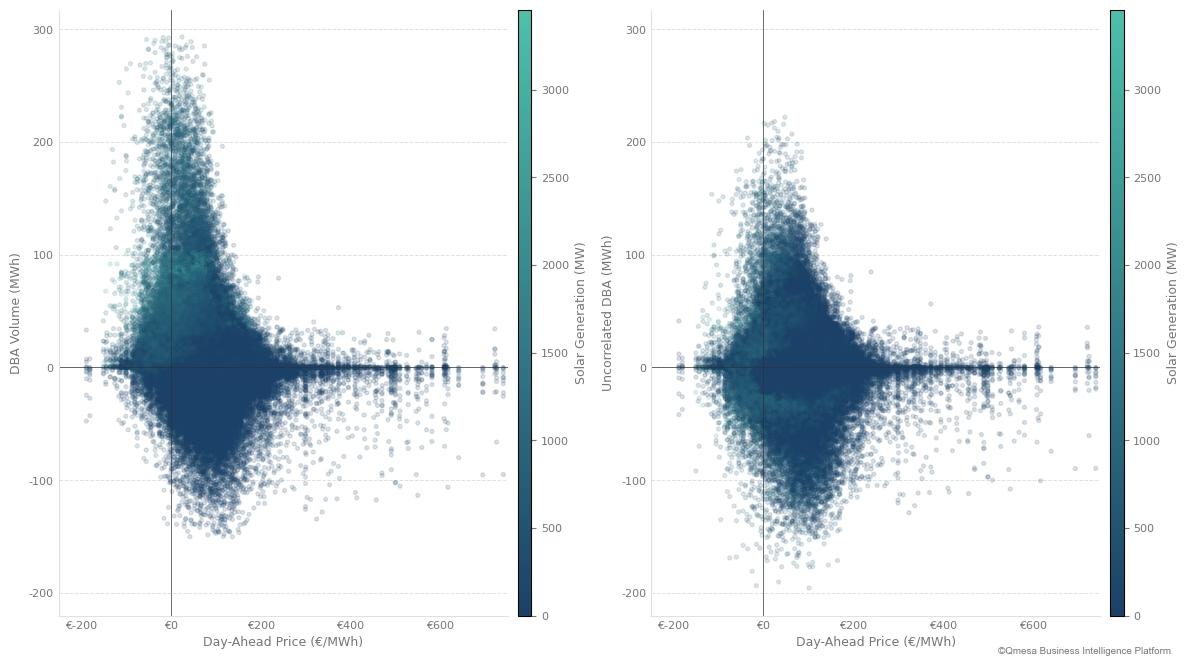
Figure 3: The Structural Problem. This scatterplot shows the correlation between DBA Volume and Day-Ahead Prices. Note the skew that shows long position in low price hours and short position in high price hours. Even after removing the solar correlation from the DBA (Right), the structural bias remains.
DBA Volume (MWh) vs. Day-Ahead Price (€/MWh)
Consequently, DSOs are systematically short or long at adverse moments, forcing them to trade volumes on the Day-Ahead market when spreads are unfavourable. To address the introduction of prosumer load profiles, we removed all PV vs. DBA correlation. Even after removing linear solar correlations, a structural value pool of €7-8M remains.
The Solution: Virtual Battery Flex as an Optimization
With the rise of Battery Energy Storage Systems (BESS), new tools will be at hand to manage DBA. The solution lies in Virtual Flexibility to manage residual load. This can be provided by energy portfolio managers who hold BESS for portfolio optimization or trading purposes.
A DSO can organize tenders to procure virtual battery flexibility products in a transparent and non-discriminatory manner, along the lines of tenders for linear forward products to cover a short position.
Just as DSOs hold short positions due to grid losses, they hold "short flex positions" that can be determined systematically. This allows the derivation of parameters for virtual battery to cover a portion of the DBA's short flex position. The battery acts as a temporal buffer, absorbing excess volume when the DBA is "Long" (and prices are low/negative) and discharging when the DBA is "Short" (and prices are high).
Mechanism in Action: We modelled this strategy using actual 2024 market data.
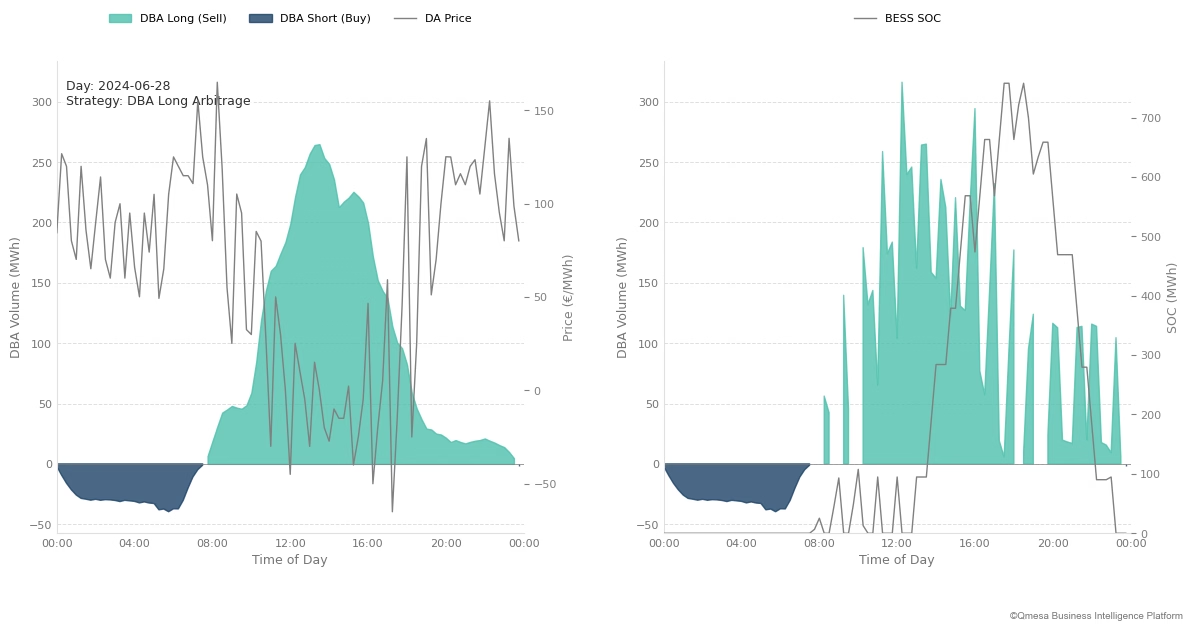
1. The "DBA Long" Arbitrage (Summer Scenario): On June 28, 2024, high solar output created a volume surplus. Instead of selling this volume into a crashing market (also at negative prices), the battery absorbs the excess (charging), effectively "buying" the DBA Long position to hold for the evening discharge.
Figure 4: Summer Strategy. The green area shows the battery absorbing the DBA surplus during midday solar peaks, preventing a sell-off at low prices.
DBA position (MWh) vs. Day-Ahead Price (€/MWh) and State-of-Charge (MWh)
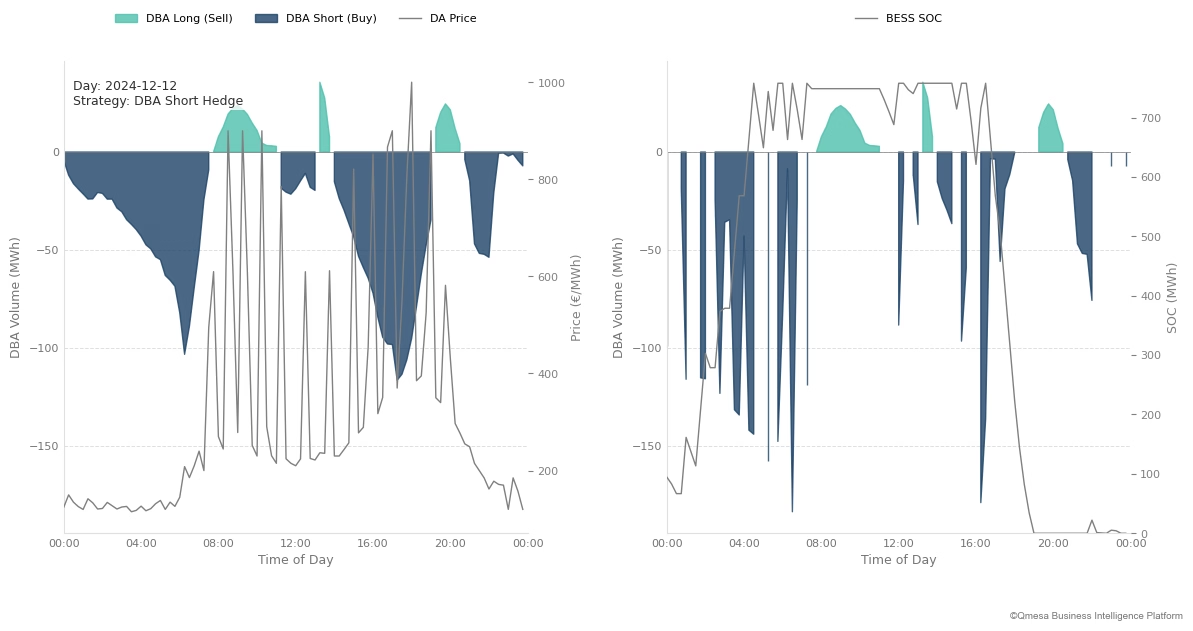
2. The "DBA Short" Hedge (Winter Scenario): On December 12, 2024, the grid faced a deficit (Short) during high-price hours. Rather than procuring expensive power from the spot market the battery discharges to cover the shortfall internally.
Figure 5: Winter Strategy. The dark blue area highlights the battery covering the DBA deficit, acting as a hedge against high spot prices.
DBA position (MWh) vs. Day-Ahead Price (€/MWh) and State-of-Charge (MWh)
The Business Case: €14M Uplift Analysis
We applied a quantitative framework to 11 selected DSOs, ensuring a representative mix of rural and urban grids with high solar or wind penetration.
Methodology:
Data Foundation: We utilized high-resolution 2024 DBA volume data and EPEX Spot Day-Ahead prices.
BESS Sizing: We simulated a total of 981 MW of battery capacity. Sizing was determined via optimization curves for each DSO to identify the "Capacity-to-DBA-Mean" ratio that maximizes net economic return.
Optimization Logic: The algorithm dispatched the battery to minimize the sum of Spot Procurement Costs, subject to physical constraints (State of Charge, C-Rates).
Risk Metric: We calculated the Conditional Value at Risk (cVaR 95%) to quantify how effectively the battery mitigates extreme "tail risk" events – the top 5% of worst financial hours.
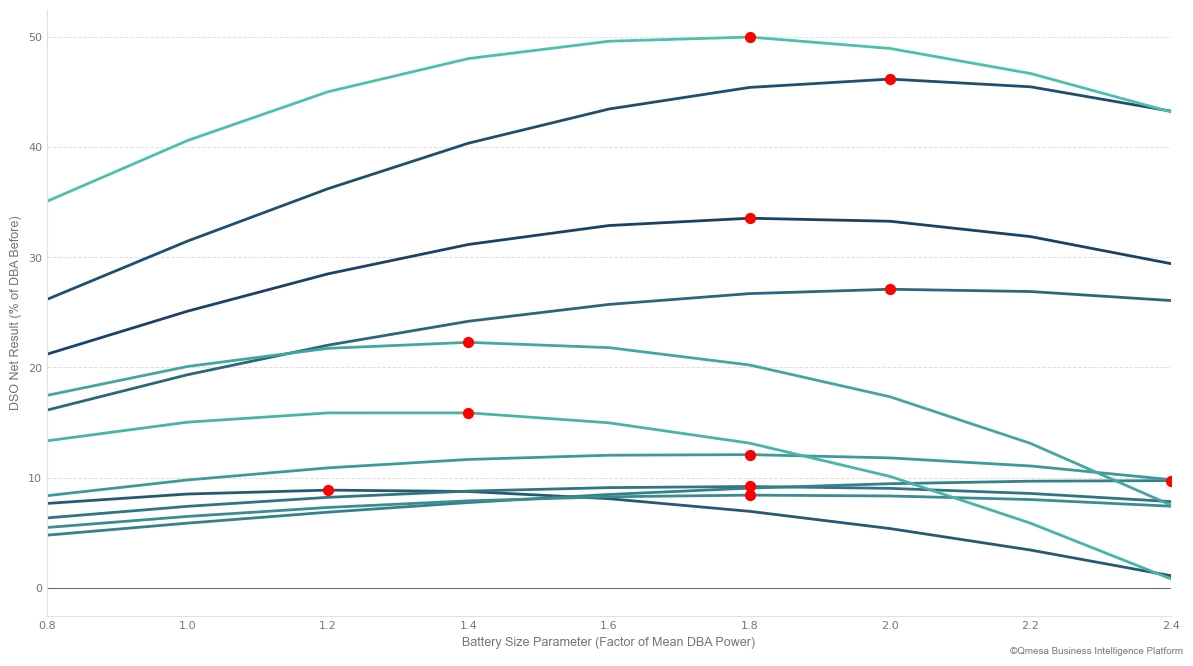
Figure 6: Optimization curves (red dots indicate optima) identifying the precise battery size factor relative to mean DBA power that yields the highest return.
DSO Net Result (% of DBA result before flex product) vs. Battery Size Parameter
The Results: The outcome of this optimization is substantial:
Day-Ahead Trading Uplift (€7.2M): A reduction in net procurement costs (or increase in potential revenues) achieved by shifting volumes out of suboptimal hours.
Risk Reduction (€6.9M): By flattening the tail risk of the portfolio (measured via cVaR 95%), DSOs reduce the capital exposure required to cover volatility.
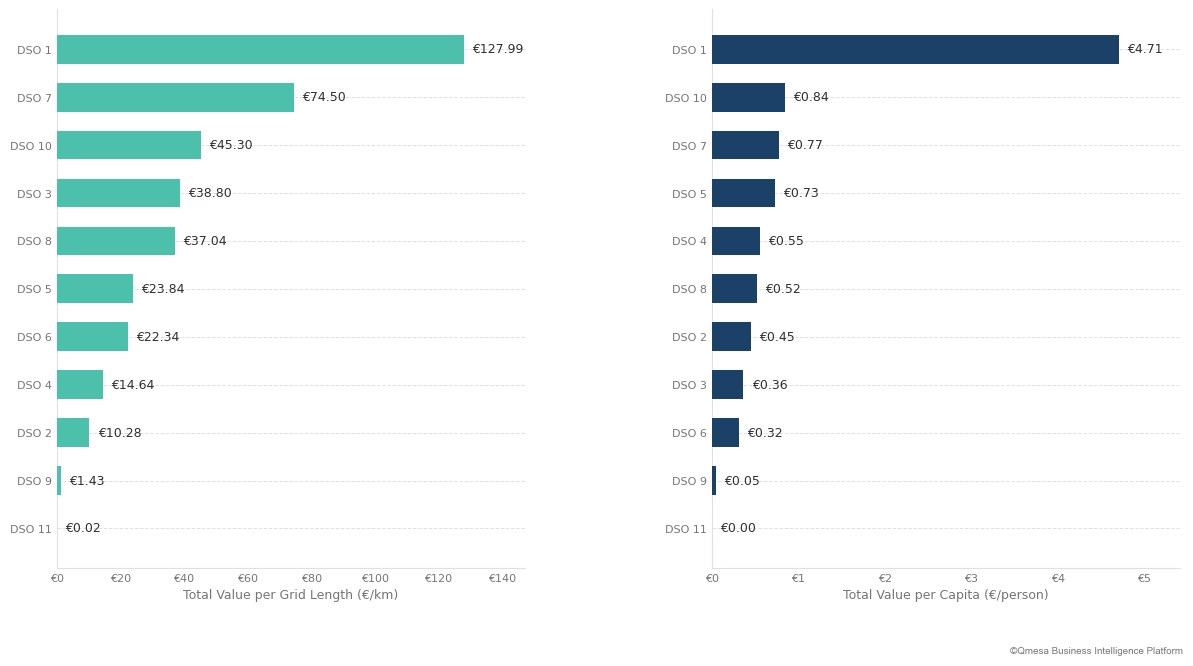
Value Per Grid Metrics: Crucially, the value is not distributed evenly. As shown in Figure 7, the potential is highly correlated with the specific topology and renewable penetration of the grid area:
High Value-Add: Rural DSOs with high solar penetration show significant uplift potential. DSO 1 leads the cluster with €127.99 uplift per km of grid length and €4.71 per capita due to higher share of unmetered PVs.
Moderate Value-Add: Urban or mixed grids show lower but steady optimization potential. DSO 3 realizes €38.80 per km (€0.36 per capita), while DSO 2 sits at €10.28 per km(€0.45 per capita).
Low Value-Add: Grid with a major share of metered assets like DSO 9, which realizes €1.43 per km (€0.05 per capita).
Implication: This disparity confirms that while the mechanism works universally, the magnitude of the "Value Pool" is specific to the DSO's unique residual load profile.
Figure 7: Total value uplift per grid length and population. Note the significant variance between DSOs, driven by their specific asset base and renewable integration levels.
Total value uplift (€)
Conclusion
The transition to improved Standard Load Profiles (like the BDEW's P25/S25) is a necessary evolution expected to decrease DBA management cost. However, while better profiling reduces predictable volume errors, it does nothing to mitigate dynamic weather dependency or the market price volatility that DSOs face daily.
Virtual Battery Flexibility Products are the suitable tool to cover remaining risk in the DBA. They allow DSOs to compensate for SLP imperfections and reduce DBA management costs on the spot market.
As our “per-kilometre” and “per capita” analyses demonstrate, the right (virtual) battery fit is not a generic solution. The primary value driver is the specific shape of the DSO's DBA profile. To unlock this value, DSOs must look beyond general assumptions and model their specific DBA exposure in detail.
Reach out to us to:
Analyze your DBA position using your real-world data,
Quantify your cost-saving and risk mitigation potential, and
Size and structure the optimal BESS product for your needs.